I have been working on machine learning for over a month using python, scikit-learn, and pandas. Over 90% of the work is on encoding the data formatting for machine learning, and rest 10% is setting up algorithms for machine learning.
Lets talk about car evaluation dataset and here is how i got 98% accuracy in prediction using RandomForest classifier. This is a 4type classification problem
Things you need
1. Scipy, Numpy, Scikit, Python, Pandas, Matplotlib
2. Car Evaluation Dataset
https://archive.ics.uci.edu/ml/datasets/Car+Evaluation
Lets take a look at the dataset:
The car evaluation dataset has comma separated values with about 7 attributes.
7. Attribute Values:

   buying       v-high, high, med, low
   maint        v-high, high, med, low
   doors        2, 3, 4, 5-more
   persons      2, 4, more
   lug_boot     small, med, big
   safety       low, med, high
and the class output. We only need the values unacc,acc,good and v-good, the rest is statistical.
class
   -----------------------------
   unacc     1210     (70.023 %)
   acc        384     (22.222 %)
   good        69     ( 3.993 %)
   vgood      65     ( 3.762 %)

If you look at the data in csv, it looks like 1728 rows.
buying,maint,doors,persons,lug_boot,safety,class
vhigh,vhigh,2,2,small,low,unacc
vhigh,vhigh,2,2,small,med,unacc
vhigh,vhigh,2,2,small,high,unacc
vhigh,vhigh,2,2,med,low,unacc
vhigh,vhigh,2,2,med,med,unacc
vhigh,vhigh,2,2,med,high,unacc
......
The problem with the above data is it has categorical lablels which is unsuitable for machine learning algorithms. You need to convert them to unique numerical values for machine learning. Lets do it with pandas in python First we will import the csv into pandas
>> df = pd.read_csv('csv.data',header=0)
>> df.info()
Int64Index: 1728 entries, 0 to 1727
Data columns (total 7 columns):
buying 1728 non-null object
maint 1728 non-null object
doors 1728 non-null object
persons 1728 non-null object
lug_boot 1728 non-null object
safety 1728 non-null object
class 1728 non-null object
As you can see from the summary, all are string objects, we want them to be converted to numeric unqiue values. In pandas you can use factorize() function to encode the labels columnwise or a simple replace() will work.
Lets encode the labels in the dataset like this, in a very simple way…
vhigh = 4 high=3 med=2 low=1
5more = 6 more =5
small =1 med=2 big=3
unacc=1 acc=2 good=3 vgood=4
df = df.replace('vhigh',4)
 df = replace('high',3)
After encoding we see the dataset like this
buying,maint,doors,persons,lug_boot,safety,class
0,4,4,2,2,1,1,1
1,4,4,2,2,1,2,1
2,4,4,2,2,1,3,1
3,4,4,2,2,2,1,1
4,4,4,2,2,2,2,1
Now our data is ready for machine learning using scikit. You can download my encoded csv file car csv data
Machine Learning Algorithm
The best and easiest machine learning algorithm i have seen is RandomForests. Pretty much you can throw at it everything and it will work. Naive Bayes or KNN are good algorithms.
Now that our data is numeric, we make setup things for machine learning.
First we convert from pandas to numpy
car = df.values
Then we split the data to X,y which is attributes and output class (small y)
X,y = car[:,:6], car[:,6]
This selects all rows then X holds first 6 column attributes and y the last column as class (1d array)
We make sure that all the values in numpy are int to avoid potential numpy problems
X,y = X.astype(int), y.astype(int)
Lets split the data for 70% train and 30% test test for scikit machine learning
X_train, X_test, y_train, y_test = cross_validation.train_test_split(X,y,test_size=0.3,random_state=0)
Now that all is setup to apply for machine learning algorithms, lets setup the RandomForestClassifier()
>>> clf = ensemble.RandomForestClassifier(n_estimators=500)
>>> clf.fit(X_train,y_train)
RandomForestClassifier(bootstrap=True, compute_importances=None,
criterion='gini', max_depth=None, max_features='auto',
max_leaf_nodes=None, min_density=None, min_samples_leaf=1,
min_samples_split=2, n_estimators=500, n_jobs=1,
oob_score=False, random_state=None, verbose=0)
>>> clf.score(X_test,y_test)
0.97880539499036612
97.88% Thats a pretty good accuracy in classification out of the box for Random forest classifier
Lets push a little bit further. Many machine learning algorithms perform very well if the data is scaled between the maximum and minimum. Lets scale the data
from sklearn import preprocessing
scaler = preprocessing.MinMaxScaler()
X_train_scaled = scaler.fit_transform(X_train)
X_test_scaled = scaler.fit_transform(X_test)
Now we apply the random forest classifier.
clf.fit(X_train_scaled,y_train)
clf.score(X_test_scaled,y_test)
>>> clf.score(X_test_scaled,y_test)
0.98265895953757221
98.2% Wow! Not bad, we just pushed the score up!!
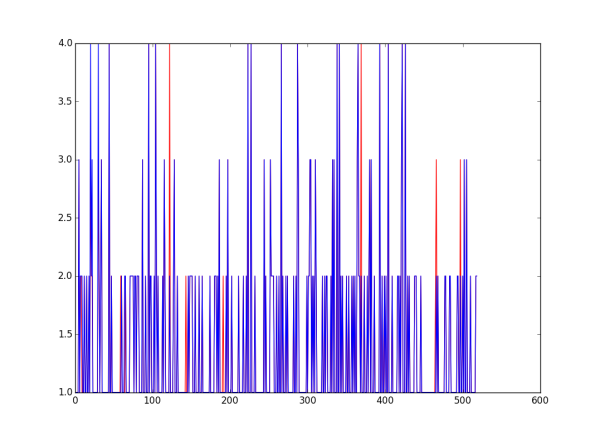
Lets predict the test data and compare it with the original y_test and plot a graph.
y_pred = clf.predict(X_test)
As you can see below, the red are original and blue are predicted values. We are not 100%


