

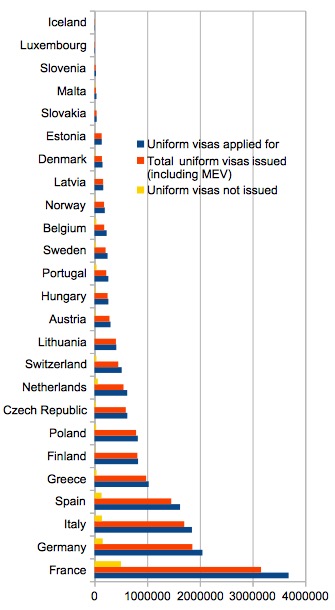
In 2017, France received about 3.6 million uniform schengen visa applications, of which over 502,526 applications were refused. Germany followed france in second place refusing about 150,000 visa applications, according the the visa statistics of the European union office.
The statistics also reveal..
- Schengen States issued 14.6 million visas for short stays in 2017
- France, Germany, Italy receive the maximum number of schengen visa applications
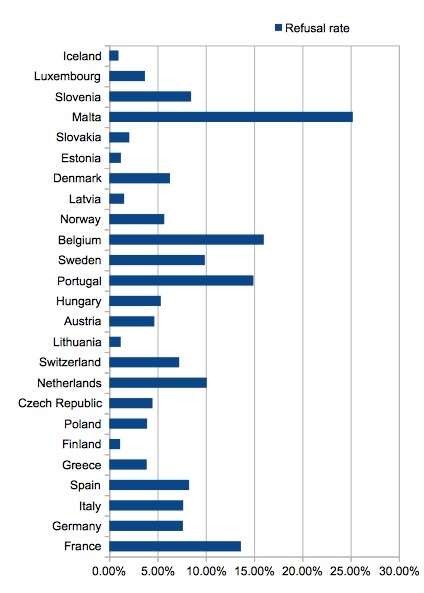
- Malta has the highest refusal rate of 25%
- Latvia, Estonia, Finland, Lithuania have the highest visa approval rates of over 98%
- 14.6 million visas issued at consulates
The percentage of applications that were refused varied widely and ranged from less than 1% to more than 35% in certain countries (Afghanistan, Algeria, Comoros, Central African Republic, Eritrea, Ghana, Guinea, Iraq, Nigeria, Senegal, Syria).
The growth was driven by the recovery in applications in the Russian Federation, which increased by more than 22% to 3.9 million, reinforcing Russia as the top source country for Schengen visa applications.
The number of applications lodged in China also returned to its pattern of growth, with 2.5 million applications representing an increase of 15.9% compared to 2016. The number of applications in Turkey remained unchanged at just under 1 million, while solid growth continued in applications lodged in India (920 000, +16.2%), Algeria (780 000, +4.7%), Belarus (720 000, +2.8%), Morocco (610 000, +10.7%), Thailand (300 000, +9.0%) and Iran (260 000, +17.9%).

Among the top 10, only Saudi Arabia experienced a decrease in applications (330 000, -3.0%), while the decline in applications lodged in Ukraine (720 000, -48.9%) is explained by the lifting of the visa requirement for holders of Ukrainian biometric passports that entered into force on 11 June 2017.
2017 Schengen visa statistics
| Schengen State | Uniform visas applied for | Total uniform visas issued (including MEV) | Uniform visas not issued | Approval rate | Refusal rate |
| France | 3684404 | 3161274 | 502526 | 85.80% | 13.64% |
| Germany | 2049055 | 1857770 | 156393 | 90.66% | 7.63% |
| Italy | 1850260 | 1703693 | 141722 | 92.08% | 7.66% |
| Spain | 1624276 | 1456906 | 134394 | 89.70% | 8.27% |
| Greece | 1029564 | 981091 | 39969 | 95.29% | 3.88% |
| Finland | 827520 | 814047 | 9337 | 98.37% | 1.13% |
| Poland | 823101 | 789343 | 32292 | 95.90% | 3.92% |
| Czech Republic | 623255 | 594225 | 27936 | 95.34% | 4.48% |
| Netherlands | 621431 | 550910 | 62778 | 88.65% | 10.10% |
| Switzerland | 517010 | 451528 | 37464 | 87.33% | 7.25% |
| Lithuania | 413966 | 406872 | 4932 | 98.29% | 1.19% |
| Austria | 304556 | 284904 | 14233 | 93.55% | 4.67% |
| Hungary | 263940 | 249393 | 14106 | 94.49% | 5.34% |
| Portugal | 263502 | 223243 | 39351 | 84.72% | 14.93% |
| Sweden | 248347 | 211219 | 24598 | 85.05% | 9.90% |
| Belgium | 231437 | 184792 | 37062 | 79.85% | 16.01% |
| Norway | 196082 | 182062 | 11176 | 92.85% | 5.70% |
| Latvia | 166800 | 164175 | 2579 | 98.43% | 1.55% |
| Denmark | 152467 | 141353 | 9585 | 92.71% | 6.29% |
| Estonia | 138249 | 136324 | 1671 | 98.61% | 1.21% |
| Slovakia | 41639 | 40552 | 866 | 97.39% | 2.08% |
| Malta | 37881 | 27785 | 9557 | 73.35% | 25.23% |
| Slovenia | 29257 | 23491 | 2481 | 80.29% | 8.48% |
| Luxembourg | 10004 | 9618 | 370 | 96.14% | 3.70% |
| Iceland | 7610 | 7154 | 73 | 94.01% | 0.96% |
Source: europa.eu