Lets take a look on how we remove stains in noisy stains in grayscale images. Kaggle has competition on denoising dirty documents https://www.kaggle.com/c/denoising-dirty-documents. Although the the performance of k-means is just average, we will understand here quality of predictions.
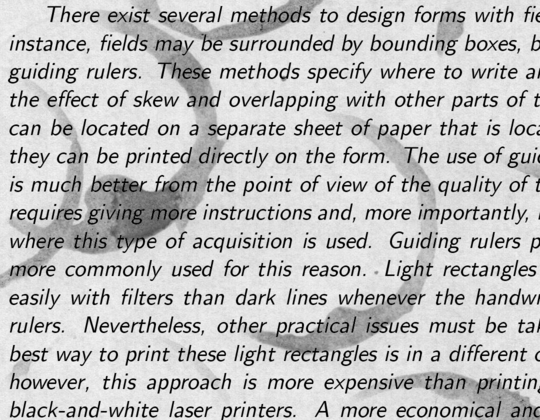
First we train a set of 144 clean png images (images are uneven dimensions so we slice image array 250×540 then import to numpy), cluster them using minibatchkmeans algorithm, and then we will see how it predicts on noisy images. We cluster them 2 clusters (2 colors) and we will see how it performs. The more the training data, the better the quality of predictions.
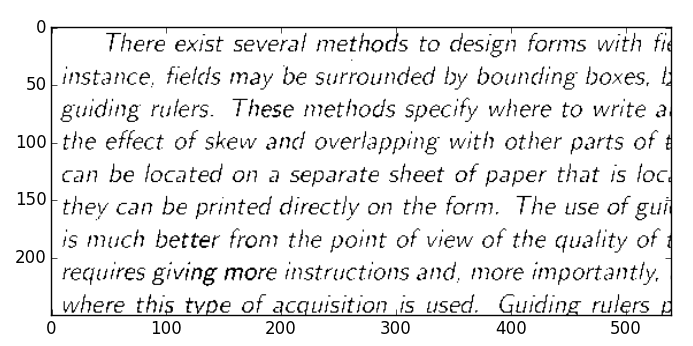
and the output is like
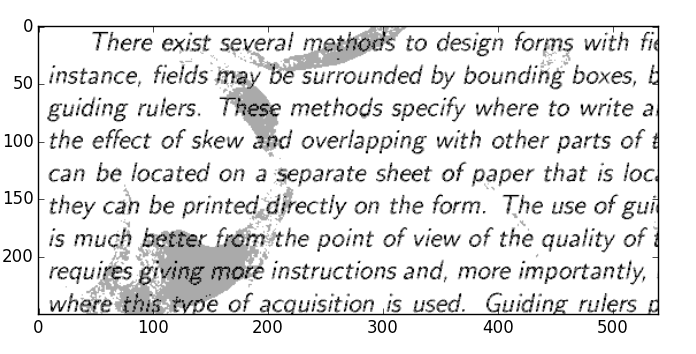
As you can see, kmeans does remove the noise but not really efficient. The code is given below:
[php]import logging
from time import time
import numpy as np
from numpy.random import RandomState
import matplotlib.pyplot as plt
from sklearn.datasets import fetch_olivetti_faces
from sklearn.cluster import MiniBatchKMeans
from sklearn import decomposition
from sklearn import cluster
from sklearn.feature_extraction import image
from scipy import misc
from scipy import ndimage
import glob
plt.ion()
n_row, n_col = 3, 3
n_components = n_row * n_col
image_shape = (250,540)
rng = RandomState(0)
patch_size = (250,540)
png=[]
for image_path in glob.glob("./train_cleaned/*.png"):
imag = misc.imread(image_path)
im = imag[:250,:540]
png.append(im)
patches = np.asarray(png, np.float32)
#patches = patches < 70
#patches = patches*50 + 100
patches = np.asarray(patches,np.float32)
print ‘Patches’, patches.shape
plt.figure()
for k,im in enumerate(patches[:9]):
plt.subplot(3,3,k+1)
plt.imshow(im.reshape(patch_size), cmap=’gray’)
plt.show()
###############################################################################
patches = patches.reshape(-1,1)
patches -= np.mean(patches, axis=0)
patches /= np.std(patches, axis=0)
print ‘Local/Global centering’, patches.shape
estimator = cluster.MiniBatchKMeans(n_clusters=4, max_iter=500,random_state=rng, verbose=True)
estimator.fit(patches)
components_ = estimator.cluster_centers_
print ‘Cluster centers’, components_.shape
print ‘Cluster labels’, estimator.labels_.shape
####################
# Prediction
clean = misc.imread("./train/170.png")
clean = np.asarray(clean,np.float32)
clean = clean[:250,:540]
#clean = clean < 70
#clean = clean*50 + 100
clean = np.asarray(clean, np.float32)
print ‘Images loaded’, clean.shape
clean = clean.reshape(-1,1)
clean -= np.mean(clean, axis=0)
clean /= np.std(clean, axis=0)
plt.imshow(clean.reshape(250,540), cmap=’gray’)
plt.show()
print ‘Reshaped again for estimator’, clean.shape
pred = estimator.predict(clean)
pred = 255-pred
#pred = 100+(255 – pred)
#Sobel edge filter
#pred = pred.reshape(250,540)
#sx = ndimage.sobel(pred, axis=0, mode=’constant’)
#sy = ndimage.sobel(pred, axis=1, mode=’constant’)
#pred = np.hypot(sx, sy)
pred = np.asarray(pred, np.float32)
print ‘Predicted’, pred.shape
plt.imshow(pred.reshape(250,540), cmap=’gray’)
plt.show()
[/php]
You can do Sobel edge detection on the text using simple scipy/numpy code
[php]#Sobel edge filter
pred = pred.reshape(250,540)
sx = ndimage.sobel(pred, axis=0, mode=’constant’)
sy = ndimage.sobel(pred, axis=1, mode=’constant’)
pred = np.hypot(sx, sy)[/php]
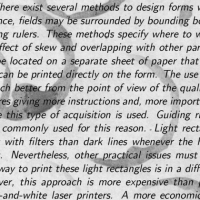
The simplest way to remove noise in dirty images, is remove background using threshholding, increasing contrast, dilation, edge detection. Lets do a simple threshholding limit 70 (remove background) and enhance the image using python and how well the stainy noise was removed.
The only code needed was
[php]patches = np.asarray(png, np.float32)
patches = patches < 70
patches = patches*50 + 100
patches = np.asarray(patches,np.float32) [/php]
Of course, the main goal of the tutorials to get into indepth understanding on k-means.