
The demand for UK investor visa to United Kingdom continues to grow among wealthy and rich around the world despite Brexit. UK offers high value tier1 investor visa £2 million and tier1 entrepreneur visa for £200,000 investment in UK businesses to international investors. UK is very popular choice for many ‘uber’ rich individuals as UK is english speaking, has excellent living standards only next to the US. For most investors applying for UK high value visas have ‘citizenship’ at the back of their mind. Citizenship in UK possible after about 6 years of living. The entrepreneur visa is the cheapest route for immigrating to UK.
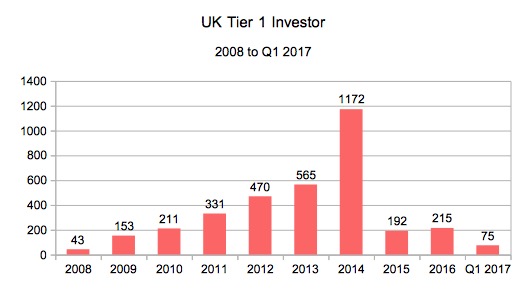
According to UK Immigration statistics, UK granted a total of 3,428 tier1 investor visas to main applicants from 2008 to Q1 2017. In Q1 2017 about 215 visas were issued. The year 2016 is the lowest with only 192 visas. In Q1 2017, entry clearance for 75 tier1 investor visas approved (main applicants). About 6,043 dependents under tier1 investor approved from 2008 to Q1 2017.
| 2008 | 2009 | 2010 | 2011 | 2012 | 2013 | 2014 | 2015 | 2016 | Q1 2017 |
| 43 | 153 | 211 | 331 | 470 | 565 | 1,172 | 192 | 215 | 75 |
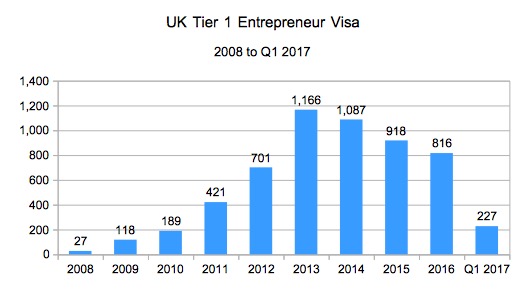
UK entrepreneur visas are much more popular because it is a lower end investment. According to UK immigration statistics, the entry clearance for 5,670 tier1 entrepreneur visas (main applicants only) approved from 2008 to Q1 2017. In Q1 2017, about 227 visas were issued.
| 2008 | 2009 | 2010 | 2011 | 2012 | 2013 | 2014 | 2015 | 2016 | Q1 2017 |
| 27 | 118 | 189 | 421 | 701 | 1,166 | 1,087 | 918 | 816 | 227 |
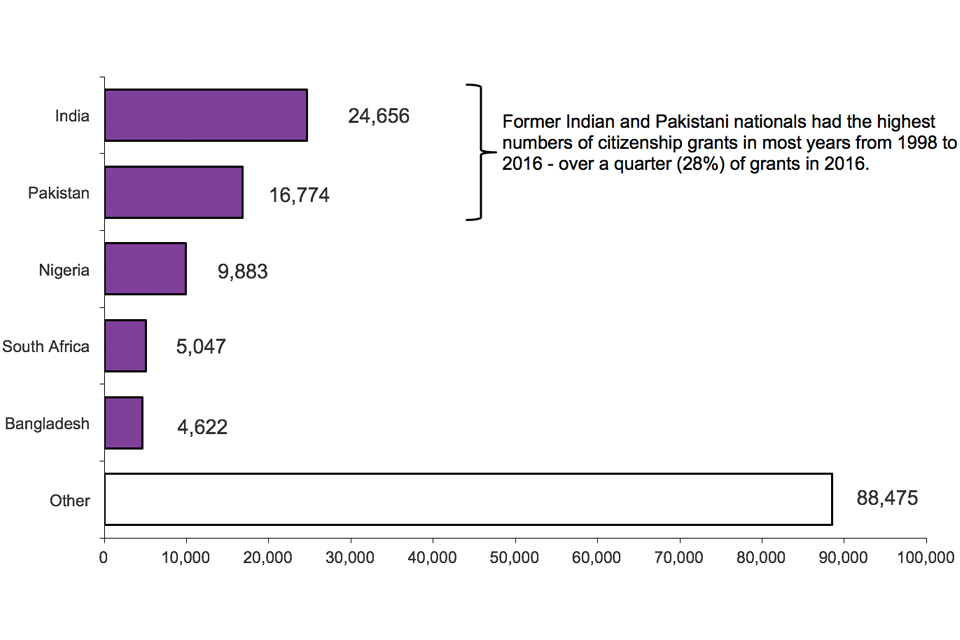
UK Home office citizenship statistics show in 2016, 149,457 persons were granted UK citizenship with Indians, Pakistanis, Nigerians and South Africans topping the table in 2016.
| ear | Total decisions | Total grants | On basis of residence | On basis of marriage | As children | Other grounds | Refusals and withdrawals |
|---|---|---|---|---|---|---|---|
| 2012 | 201,087 | 194,209 | 107,102 | 39,122 | 42,964 | 5,021 | 6,878 |
| 2013 | 215,258 | 207,989 | 113,339 | 46,301 | 44,275 | 4,074 | 7,269 |
| 2014 | 131,827 | 125,653 | 62,511 | 26,185 | 32,298 | 4,659 | 6,174 |
| 2015 | 129,132 | 118,053 | 60,762 | 24,434 | 28,724 | 4,133 | 11,079 |
| 2016 | 163,350 | 149,457 | 77,664 | 26,786 | 36,861 | 8,146 | 13,893 |
| Change: latest year | +34,218 | +31,404 | +16,902 | +2,352 | +8,137 | +4,013 | +2,814 |
| Percentage change | +26% | +27% | +28% | +10% | +28% | +97% | +25% |